
Consumers Respond to Advertising on Online Dating Services and Apps
The Colling Media market research team conducted a national Snapshot Study to understand consumer attitudes and the effectiveness of advertising on online dating services and apps.
The national survey, conducted on October 11, surveyed 1,000 adults from throughout the U.S. Question and answer options were randomized to control potential ordering bias. In order to ensure recency and control for memory, respondents were asked about their behavior “within the past week.”
5. Key findings of the national survey of adults in the U.S.
1. 33% of survey responders used a dating service or dating app within the past week
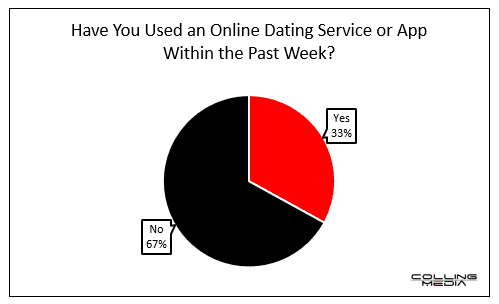
Overall, the U.S. adoption of online dating services and apps is strong. When respondents were asked if they had used an online dating service or app within the past week, 33% of them said yes.
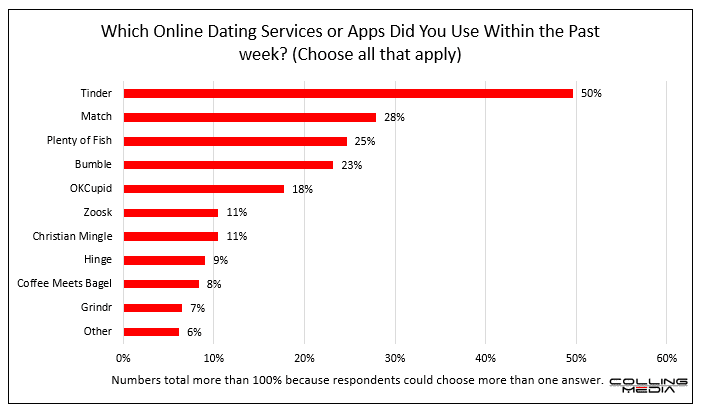
There are many services and apps competing for the same market, and some have achieved significant saturation. The clear leader is Tinder (used by 50% of those who said they used an online dating service or app), followed by Match (28%), Plenty of Fish (25%), Bumble (23%), and OKCupid (18%). Off the pace are Zoosk and Christian Mingle (both 11%), Hinge (9%), Coffee Meets Bagel (8%), and Grindr (7%).
2. Users utilize multiple dating services/apps
A significant finding of the Colling Media Snapshot Survey is users of these services/apps do not act beholden to a single provider and there is measurable usage overlap. The average respondent uses at least two services (1.96) at the same time, and 22% use three or more different apps.
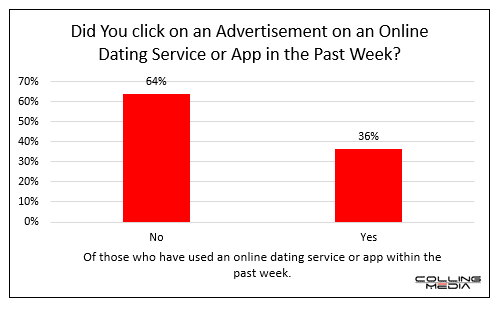
3. 36% of online dating service users clicked on an in-app advertisement
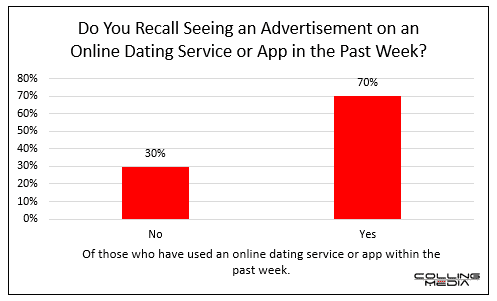
Owners of online dating services and apps introduced advertising in order to monetize the platforms. and consumers have taken notice. Impressively, 70% of respondents recall seeing advertisements on the services and apps, and, perhaps more meaningful, 36% of those who use online dating services and apps report clicking on an advertisement.
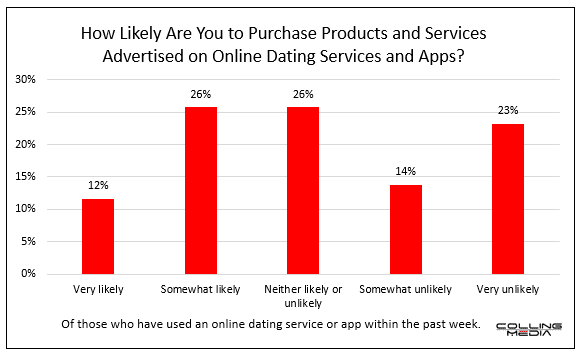
4. 38% of users are “very likely” or “somewhat likely” to purchase from an ad
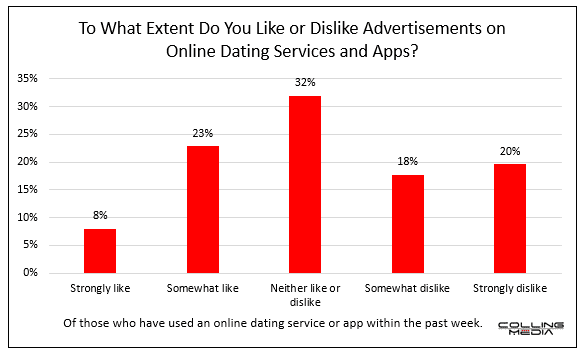
The Colling Media survey reveals additional evidence advertising on online dating services and apps may be effective—31% of respondents say they “strongly like” or “somewhat like” ads on the platforms, while another 32% neither like nor dislike such ads. When asked how likely they would be to purchase a product or service from these ads, 38% of respondents said they would be “very likely” or “somewhat likely” to do so, while 26% expressed no opinion.
5. 47% of online dating app users are currently in a relationship
While not related to advertising or marketing, the Colling Media survey posed a question to consumers revealing an unexpected and fascinating data point. Among those who say they used an online dating service or app within the past week, 47% say they are currently in a relationship.
INSIGHTS
From traditional TV to niche programmatic ads on streaming services, and from paid search to social media advertising, brands have more channels than ever to reach potential customers. New media opportunities are evolving, as is the case with online dating services and apps. Our data makes it clear a large number of users like and appreciate advertising on these platforms, and their behavior supports it. Advertisers looking for a competitive advantage would do well to explore and test branding, sales, and lead-generation opportunities on online dating services and apps.
For more on how Colling Media helps companies grow using digital advertising, contact us to get started today!